This guide compares BioLogic's technical explanations, updated in November 2024, with SparkFun's introductory resistance model. It examines the test signal, recorded response, timing, measurement boundary, and limits of interpretation. Sources were checked on October 30, 2026. The worked example is hypothetical arithmetic, not an AntBattery test result.
What Battery Internal Resistance Represents
A simple battery model contains an ideal voltage source and a resistor in series. Under a load, that resistor represents a voltage drop. This model helps explain why a battery's terminal voltage can change when current changes, but it does not describe every part of a real battery's response.
BioLogic's explanation of internal resistance distinguishes ohmic contributions from processes such as charge transfer and diffusion. Their contributions depend on the time scale being observed. The apparent resistance therefore needs a measurement method attached to it; it is not one constant that applies to every load, frequency, or observation time.
The unit milliohm, written mΩ, describes the size of a resistance value. It does not identify how that value was obtained. Two reports can use the same unit while measuring different responses.
ACIR and DCIR Require Different Test Descriptions
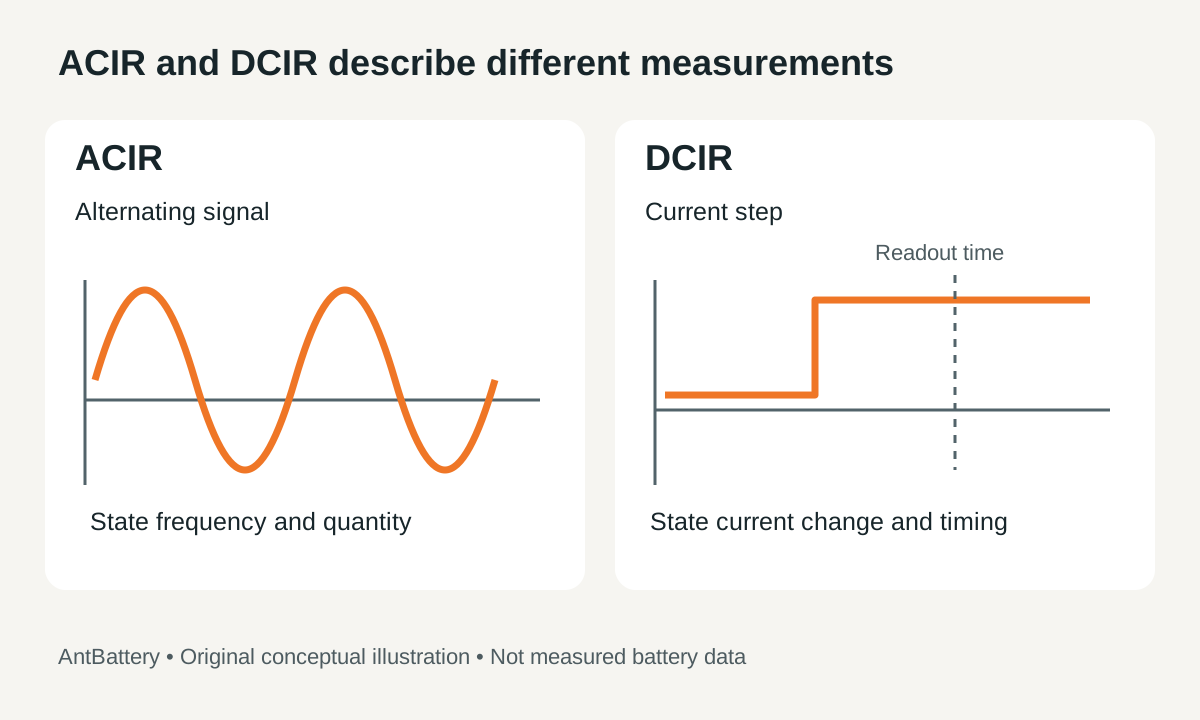
ACIR means alternating-current internal resistance. DCIR means direct-current internal resistance. Both labels need additional test details before their results can support a comparison.
| Report detail | ACIR | DCIR |
|---|---|---|
| Applied signal | An alternating signal at a stated frequency | A specified change in direct current |
| Recorded response | The instrument's stated resistance or impedance quantity | The voltage change associated with the current change |
| Essential method details | Frequency, signal amplitude, and reported quantity | Initial and final current, pulse duration, and voltage readout time |
| Interpretation limit | One frequency does not describe the full frequency response | One readout time does not describe the full time response |
| Comparison requirement | Match the reported quantity and measurement conditions | Match the current-step method and measurement conditions |
BioLogic describes a frequency of 1 kHz as typical for single-frequency ACIR in its discussion of resistance measurement techniques. This is an example of common practice, not a specification for every cell or test. A report should state the actual frequency instead of leaving the reader to assume it.
The reported AC quantity also matters. Do not assume that every instrument value represents only pure ohmic resistance. Capacitive and inductive effects can affect the interpretation. Electrochemical impedance spectroscopy, or EIS, examines impedance across a range of frequencies; a single-frequency ACIR result is not a complete EIS spectrum. BioLogic's measurement-method explanation describes these distinctions and the time dependence of DC measurements.
For a report review, keep ACIR and DCIR values in separate fields. This guide provides no universal conversion multiplier between them. A model-specific relationship would need its own supporting data and defined conditions before it could justify a comparison.
Scroll the diagram horizontally to read every label.
DCIR Calculations Depend on the Current Step and Readout Time
For the discharge-current convention used here, the resistance calculation is:
DCIR = (voltage before the step − voltage at the stated readout time) ÷ (current after the step − current before the step).
The current values must correspond to the voltage observations. The readout time also belongs with the result because the voltage response can change during the pulse. BioLogic's measurement-method explanation gives this voltage-change divided by current-change relationship; it does not establish a universal pulse duration or load for every battery.
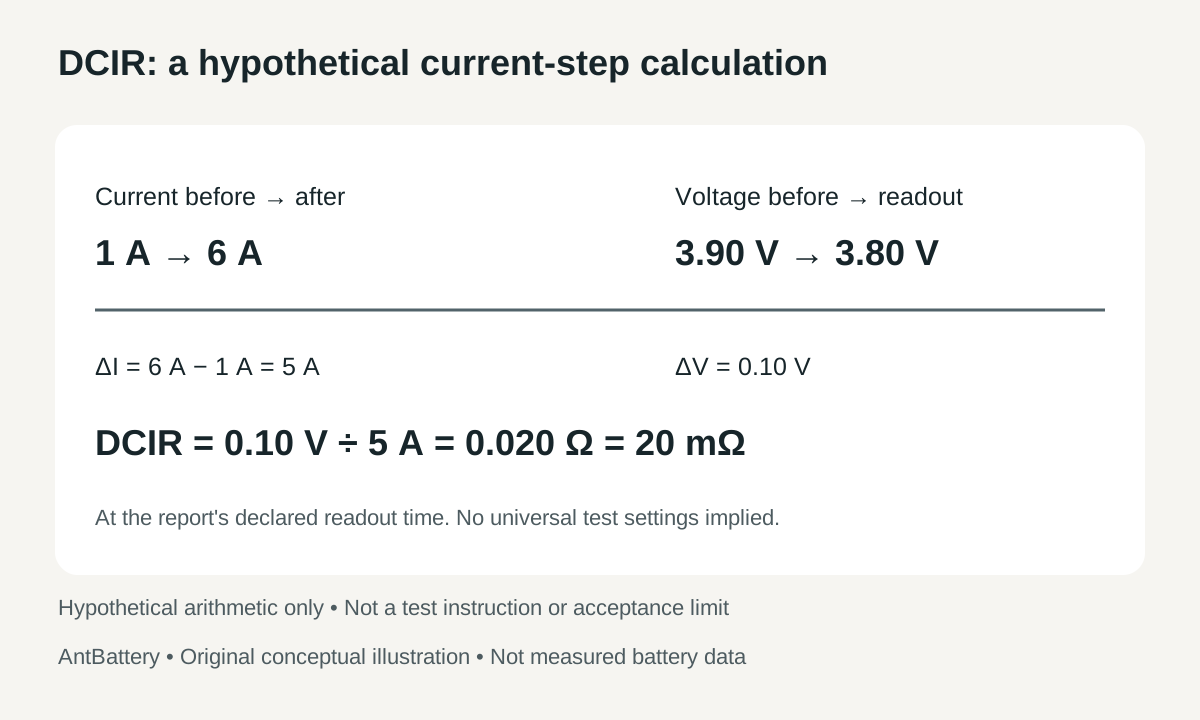
Consider a hypothetical report in which discharge current changes from 1 A to 6 A. Voltage changes from 3.90 V to 3.80 V at the report's declared readout time:
- Current change: 6 A − 1 A = 5 A.
- Voltage change: 3.90 V − 3.80 V = 0.10 V.
- Calculated resistance: 0.10 V ÷ 5 A = 0.020 Ω = 20 mΩ.
The denominator is the 5 A change, not the final current of 6 A. The resulting 20 mΩ must remain attached to the method and readout time that produced it. If that time is missing, the arithmetic alone cannot establish comparability with another report.
Scroll the diagram horizontally to read every label.
This example does not establish that a particular cell may safely carry either current. Use the separate explanation of battery C-rate and current ratings when reviewing how current relates to a battery's stated capacity and rating.
Comparable Results Need a Recorded Test State
A resistance reading describes a battery at the time of measurement. SparkFun's introductory explanation notes that factors such as age and temperature can affect the result. Its educational AA-battery example does not provide numerical acceptance limits for lithium batteries.
For document review, record the following fields beside each resistance result:
- Exact battery model, sample identity, and whether the object is a cell or a pack.
- State of charge and how that state was established.
- Temperature, preceding conditioning, and any reported rest period.
- AC frequency and signal amplitude, or DC current step and readout time.
- Instrument, fixture, measurement terminals, and procedure reference.
These are recommended reporting fields, not prescribed test settings. Their purpose is to reveal whether two reports describe sufficiently similar measurements. Follow the applicable model documentation or agreed test procedure when deciding which conditions must match.
If a report omits a field, mark it as unknown and ask for clarification. Do not invent a temperature correction, assumed state of charge, or rest interval to make two values appear comparable.
Cell and Pack Measurements Need a Defined Boundary
The measured object matters as much as the method. A cell result and a pack-terminal result do not automatically describe the same electrical path.
BioLogic's internal-resistance explanation includes contacts and connectors among the sources of ohmic resistance. A report therefore needs to identify the terminals and connections included in the measurement. Otherwise, a difference between results may be attributed to the cells even though the measurement boundaries differ.
Record whether the value applies to an individual cell, an assembly, or the complete pack at named terminals. Also identify the fixture or connection arrangement described by the test procedure. Do not apply a universal cell-to-pack multiplier without an appropriate model and evidence for the actual assembly. This boundary check is a documentation task; it is not an instruction for connecting test equipment to an energized pack.
Resistance Trends Do Not Establish Capacity or Safety
A resistance trend is most useful when the same object or comparable samples are measured using a consistent method and recorded conditions. Before interpreting a change, check whether the procedure, instrument, temperature record, or measurement boundary also changed.
Use a reference defined for the relevant model and test method when making an acceptance decision. A milliohm limit taken from an unrelated chemistry, cell format, or test method is not an adequate basis for accepting or rejecting a battery. This guide does not supply a universal good-or-bad resistance threshold.
Resistance describes a voltage response relative to current. Delivered capacity and energy require their own defined discharge measurements. A resistance figure alone therefore does not measure capacity, certify a safe operating current, or establish suitability for an application.
For the broader decision about what evidence to request before accepting samples, use the battery sample acceptance plan. It addresses the wider qualification process; the worksheet below addresses whether resistance reports can be compared.
A Practical Worksheet for Comparing Resistance Reports
Use this worksheet to review the documentation before ranking numerical results. Keep each report's original units, method name, and stated conditions.
| Report check | Information to retain | If the information is missing or different |
|---|---|---|
| Object and boundary | Exact model, sample identity, cell or pack, and measurement terminals | Clarify what was measured before comparing values |
| Method and quantity | ACIR, DCIR, or EIS; the instrument's reported quantity | Keep results separate until the quantity is identified |
| Signal and timing | AC frequency and amplitude, or DC current step, pulse duration, voltage data, and readout time | Request the method details or a matched measurement |
| Test state | State of charge, temperature, conditioning, and rest information required by the procedure | Record unknowns; assess comparability under the agreed procedure |
| Reference and decision | Applicable model reference and acceptance rule, if one exists | Avoid a pass-or-fail conclusion from the number alone |
Classify the reports according to the evidence available:
- Comparable for the stated purpose: the measurement method, quantity, boundary, and relevant conditions match, with enough information to apply the intended comparison.
- Conditionally useful: the method is understood, but a documented difference limits the conclusion. State that limitation explicitly.
- Not yet comparable: essential details are missing, or one report gives ACIR while the other gives DCIR without supporting evidence for the proposed comparison. Request clarification or results from a matched method.
When considering a model in the AntBattery battery product catalogue, identify the exact model and ask which method-specific documentation is available. Include the resistance report, its stated conditions, and the intended current requirement in the enquiry. The available documents and the application's requirements determine the next evaluation step.