Attach three labels before you compare anything
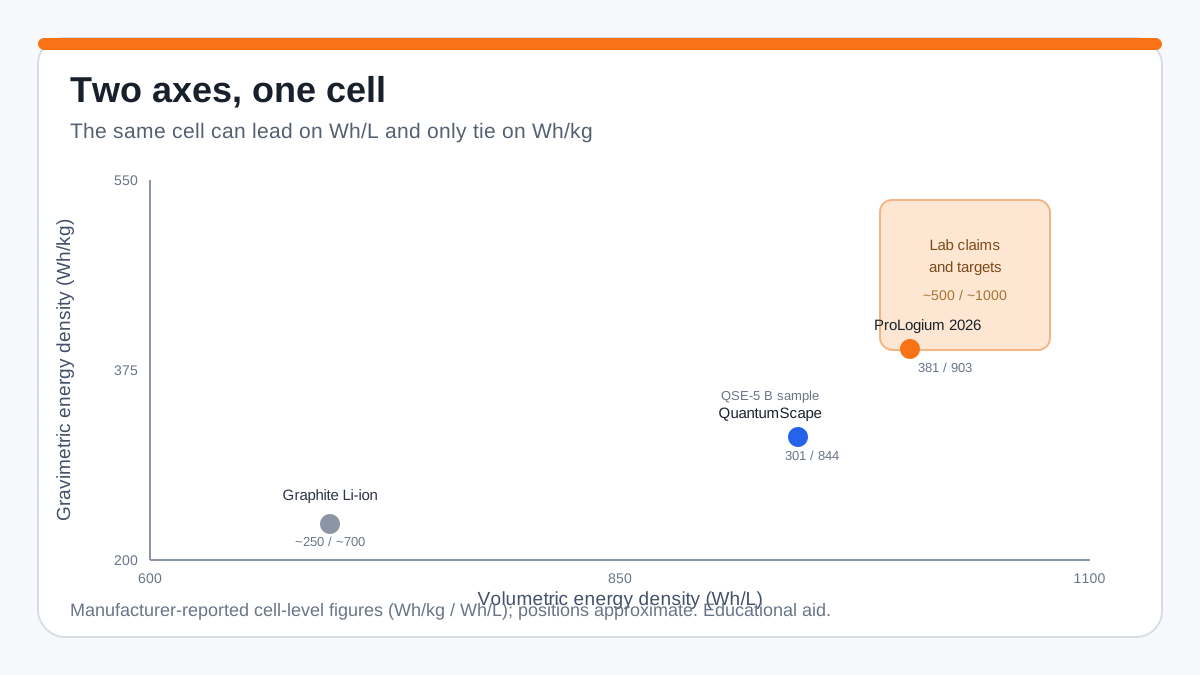
A solid state battery energy density figure is only usable once you attach three labels to it: is it gravimetric (Wh/kg) or volumetric (Wh/L); is it material-level, cell-level or pack-level; and did it come from a lab coupon cell or a production-representative cell. A number without those labels cannot be compared with anything. Two 2026 examples show why: ProLogium's announced 185.4 Ah cell is quoted at 381 Wh/kg and 903 Wh/L, while QuantumScape's QSE-5 B sample is quoted at 301 Wh/kg and 844 Wh/L. Both say "solid-state" and both land near 850 to 900 Wh/L, yet one is about 27 percent higher on Wh/kg than the other.
Energy density is delivered energy divided by something. Gravimetric energy density is watt-hours per kilogram; volumetric energy density is watt-hours per litre. The denominator is where the ambiguity lives: at the material level it is one active material, at the cell level it is the whole cell including current collectors, the separator or solid electrolyte, binder, tabs and packaging, and at the pack level it adds module structure, battery-management electronics, cooling and any pressure hardware. Lithium metal has a theoretical specific capacity near 3861 mAh/g, roughly ten times graphite's practical 372 mAh/g, and a volumetric capacity near 2062 mAh/cm3, about three times graphite. Those material-level numbers set the ceiling, not the cell.
This guide is the deep dive on one line item in our broader method for how to verify a solid-state battery claim: the energy-density number. Everything below assumes you already hold a figure from a supplier or an announcement and need to decide what it means.
Gravimetric versus volumetric: the same cell, two stories
A spec sheet that quotes only one axis is not describing the same cell as one that quotes the other. Gravimetric energy density rewards removing mass; volumetric energy density rewards removing volume. A design can win decisively on one and only tie on the other.
The two most-quoted solid-state cells of 2026 make the point. ProLogium reported that a 185.4 Ah large-format cell of its Gen 3.5 Lithium Ceramic Battery reached 381 Wh/kg and 903 Wh/L, with TUV Rheinland reviewing the energy-density figures. QuantumScape reported that the B sample of its QSE-5 cell, an anode-free design with a ceramic solid separator and about 5 amp-hours of capacity, delivered a measured 21.6 watt-hours at a C/5 discharge and 25 degrees Celsius, which works out to 844 Wh/L and 301 Wh/kg.
Read together, those are not contradictory. The two cells are close on volumetric energy density. On gravimetric energy density ProLogium's figure is about a quarter higher, consistent with a different cell construction and mass fraction. If a supplier gives you only the volumetric number, you have learned almost nothing about how heavy their pack will be. Ask for both, measured on the same cell.
Material, cell and pack: where the number gets discounted
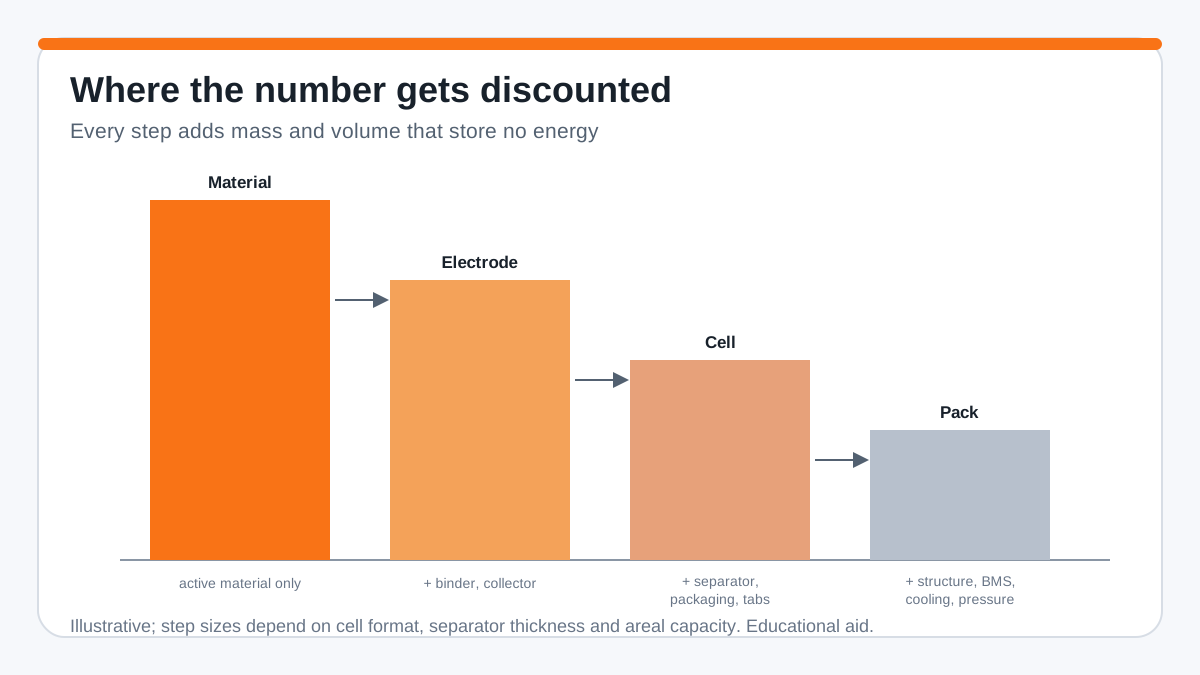
Every step from an active material to a delivered pack adds mass and volume that store no energy, so the energy-density number falls at each step.
Material to cell. An analysis of energy densities for sulfide solid-state batteries points out that most published work evaluates energy density using only the cathode active-material mass and ignores the solid electrolyte, current collectors and packaging, which is the main reason reported and practical figures diverge. That work models cell-level systems targeting 300, 350 and 400 Wh/kg with a sulfide electrolyte. For lithium cobalt oxide solid-state cells with an approximately 50 micrometre solid-electrolyte separator, a summary of the same analysis gives roughly 410 to 280 Wh/kg and roughly 820 to 560 Wh/L as the electrode's active-material content falls, against roughly 250 Wh/kg and 700 Wh/L for a conventional graphite lithium-ion cell. Separator thickness alone moves the number by a large margin.
Cell to pack. QuantumScape states that a cylindrical-format cell loses roughly 9 percent of its energy density purely from packing cylinders into a rectangular pack, before any structure or electronics. A single-cell-level assessment in ACS Energy Letters adds that the volume change from plating lithium creates significant strain, up to about 17 percent, in larger prismatic cells, and suggests large lithium-metal packs may need a pressure-management system in the same way conventional packs need a thermal-management system. That hardware is pack mass and volume a cell-level number never sees. A "500 Wh/kg" claim means a very different thing at each level, and a supplier who does not say is leaving off the most important label.
Why lab-coupon numbers discount toward production
Even at a fixed cell-level boundary, a small laboratory cell and a production-representative cell built from the same materials report different energy densities. A techno-economic assessment in Nature Energy puts it directly: solid-state lithium-metal batteries show promise for gravimetric and volumetric energy densities upwards of 500 Wh/kg and 1,000 Wh/L, but most experimental reports at the cell level fall well short of state-of-the-art lithium-ion because of high solid-electrolyte thicknesses and low areal capacities.
Two levers explain most of the gap. A lab cell often uses a thick, robust electrolyte pellet that is easy to handle but heavy; a production cell needs a thin separator that is hard to make defect-free. And a lab cell often runs a low areal capacity, a thin coating that cycles cleanly but dilutes the active fraction; a long-range fast-charging electric-vehicle electrode needs to reach a practical areal capacity of at least about 7 mAh/cm2 while still accepting roughly a 4C charge, according to the same ACS Energy Letters assessment. The Faraday Institution frames the target from the other side: hitting a 1,000 Wh/L automotive figure constrains the lithium anode reservoir to no more than about 17 micrometres.
This is why company laboratory claims and targets belong in a separate column from measured production cells. The Faraday Institution notes a company laboratory claim of roughly 450 Wh/kg cells and a separate aspirational claim of 1,000 Wh/kg with a ten-year life; both are real statements but neither is the same evidence class as an independently reviewed cell. The lithium-metal negative electrode is the lever behind much of the energy-density gain, but this guide does not treat anode architecture as an independently released topic.
How to normalize two competing supplier figures
When two suppliers send you energy-density numbers, do not rank them. Run each one through the same six questions, then compare the answers.
Sort the result: accept if both figures survive all six questions on the same basis; needs clarification if a label is missing; not comparable if the two figures sit at different boundaries, stages or conditions and the supplier will not restate them. An open cell-level estimator that includes inactive components, such as the SolidPAC battery-on-demand estimator published in Cell Reports Physical Science, is a reasonable way to put two figures on the same basis when the assumptions differ.
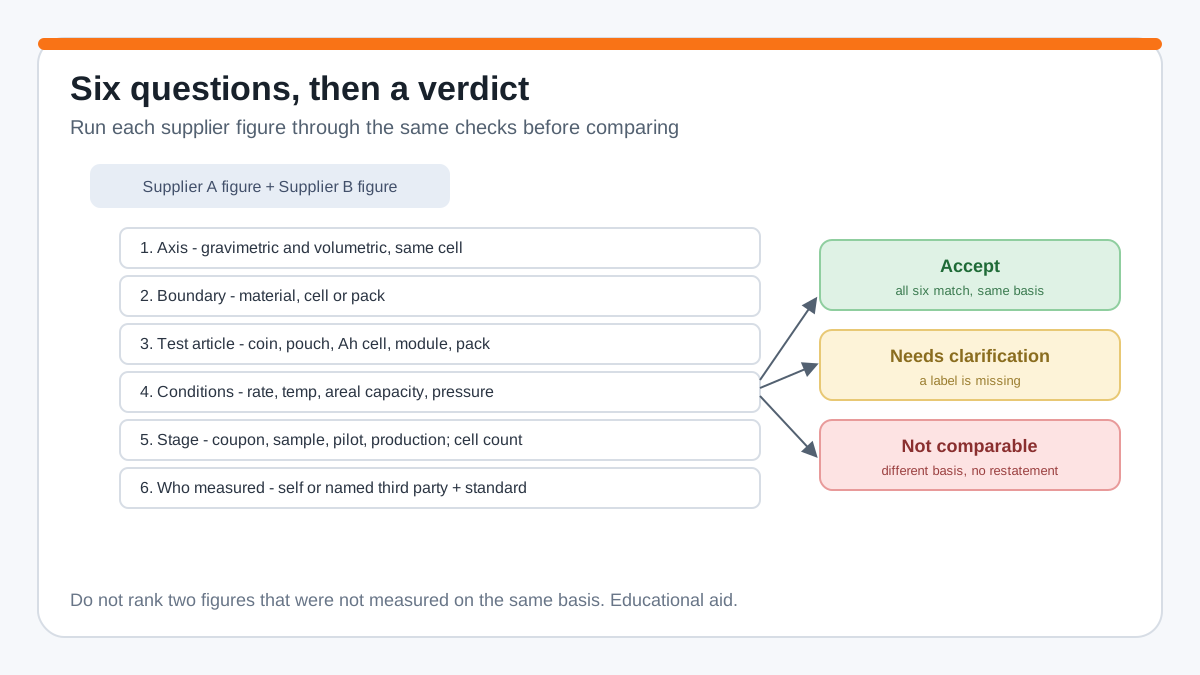
- Axis: gravimetric, volumetric, or both? Insist on both, from the same cell.
- Boundary: material, cell or pack? Ask for the measured watt-hours and the full test-article mass and dimensions, not a projection from component capacity.
- Test article: coin cell, single-layer pouch, multilayer amp-hour cell, module or pack? A number from a press cell does not transfer to a pack.
- Conditions: discharge rate, temperature, voltage window, areal capacity, first-cycle loss, and any external stack pressure.
- Stage: research coupon, engineering sample, B sample, pilot line or production-representative, and how many cells were measured, not just the best one.
- Who measured it: the supplier alone, or a named third party under a named standard, with the report available.
Worked example: ProLogium 381 Wh/kg versus QuantumScape 301 Wh/kg
Put the two 2026 cells through the procedure. Axis: both suppliers give both axes, ProLogium 381 Wh/kg and 903 Wh/L, QuantumScape 301 Wh/kg and 844 Wh/L. Boundary: both are cell-level, single announced cells, not packs, and neither figure includes module structure or pressure hardware.
Test article: different. ProLogium's is a 185.4 Ah large-format cell; QuantumScape's is an approximately 5 Ah cell, and larger cells generally carry a smaller inactive fraction. Conditions: QuantumScape states C/5 at 25 degrees Celsius and a measured 21.6 Wh; ProLogium attributes its energy-density figures to a TUV Rheinland review and adds that UL Solutions tested the cell under the China standard GB/T 43568-2026, including a vacuum-and-heat test with under 0.05 percent weight loss against a 0.5 percent threshold, but the public detail on discharge conditions is thinner. Stage: ProLogium said mass production had begun; QuantumScape's number is from a B sample. Who measured it: ProLogium's energy density was reviewed by TUV Rheinland; QuantumScape's is a company measurement.
Verdict: the two cells are comparable on volumetric energy density and both are credible cell-level figures, but they are not directly comparable on gravimetric energy density without normalizing for cell size and stage, and neither is a pack figure. That is a useful, honest conclusion, and the kind you should expect most of the time. For how a normalized solid-state cell figure stacks up against the LFP and NMC cells shipping in volume today, see our solid-state versus LFP versus NMC comparison.
Bring an energy-density target to the RFQ
If you are scoping solid-state cells for a program, do not ask "what is your energy density." Send your requirement on a fixed basis: the target gravimetric and volumetric figure, the boundary you need it at (cell or pack), the areal capacity, charge rate, temperature window and stack pressure your application allows, and the sample stage you need to see. Then ask every supplier to answer on that basis.
Review the battery product families for format and voltage context, then use the technical contact path to request samples and align on a test protocol. AntBattery can discuss a project-specific cell and supply an evidence package on the same measurement basis. No single cross-chemistry energy-density figure is implied by this article.
FAQs
What is the energy density of a solid-state battery?
It depends on the cell and the boundary. Two solid-state cells quoted in 2026, ProLogium's 185.4 Ah cell and QuantumScape's QSE-5 B sample, sit at roughly 300 to 380 Wh/kg gravimetric and 840 to 900 Wh/L volumetric at the cell level, against about 250 Wh/kg and 700 Wh/L for a conventional graphite lithium-ion cell. Laboratory claims and automotive targets reach toward 500 Wh/kg and 1,000 Wh/L, but those are potentials, not shipping cells.
Is a solid-state battery's energy density double lithium-ion?
Not as a shipping-cell fact. The Faraday Institution describes a potential to store up to about 70 percent more energy per unit volume, and lithium-metal chemistries could in principle improve gravimetric and volumetric energy density by up to roughly four and two times. A "double" or "2x" headline usually compares a projected material or future cell against a lithium-ion pack shipping today, which is not a like-for-like comparison.
What is the difference between gravimetric and volumetric energy density?
Gravimetric energy density is watt-hours per kilogram; volumetric energy density is watt-hours per litre. A cell can be well ahead on one and only even on the other, as QuantumScape's QSE-5 B sample shows with 844 Wh/L but 301 Wh/kg. Always ask a supplier for both figures from the same cell.
Why is a cell's energy density lower than the material number?
Because the cell number includes everything that stores no energy: the solid electrolyte or separator, current collectors, binder, tabs and packaging. An analysis of sulfide solid-state cells notes that most published energy densities count only the cathode active material, which is why reported and practical figures diverge, and that separator thickness alone moves the result substantially.
How much energy density is lost from cell to pack?
It varies by format, but QuantumScape states that a cylindrical cell loses roughly 9 percent of its energy density from pack geometry alone, before module structure, electronics, cooling or, for a lithium-metal design, pressure hardware are added. Treat a cell-level figure as an upper bound on the pack.
How do I compare two suppliers' energy-density claims?
Run each figure through the same six questions: axis (gravimetric and volumetric), boundary (material, cell or pack), test article, test conditions, development stage, and who measured it under which standard. Then sort the pair into accept, needs clarification, or not comparable. Do not rank two numbers that were not measured on the same basis.
Sources and further reading
- ProLogium Technology - Begins Mass Production of High-Energy-Density All-Solid-State Battery, Reaching 381 Wh/kg and 903 Wh/L (press release, 2026-09-02)
- QuantumScape - A First Look at the QSE-5 B Sample (2024-10-23)
- Faraday Institution - Faraday Insights Issue 5: Solid-State Batteries (February 2020, full text)
- Practical evaluation of energy densities for sulfide solid-state batteries - Energy Storage Materials 2019 (abstract consulted; full text paywalled)
- Surendran & Thangadurai - Solid-State Lithium Metal Batteries for Electric Vehicles: Critical Single Cell Level Assessment of Capacity and Lithium Necessity, ACS Energy Letters 2025, 10(2), 991-1001 (abstract consulted; full text paywalled)
- Techno-economic assessment of thin lithium metal anodes for solid-state batteries - Nature Energy 2024 (abstract consulted)
- Attainable Gravimetric and Volumetric Energy Density of Li-S and Li Ion Battery Cells with Solid Separator-Protected Li Metal Anodes - J. Phys. Chem. Lett. 2015 (abstract consulted)
- SolidPAC is an interactive battery-on-demand energy density estimator for solid-state batteries - Cell Reports Physical Science 2022 (abstract consulted)
Related Blogs
Learn More About Battery
Related Products
Related product
Prismatic Series
AB-100AH Semi Solid Prismatic Cell
- Energy Density
- 285 Wh/kg
- Nominal Voltage
- 3.65 V
Pouch Cell Series
AB-50AH Semi Solid Pouch Cell
- Energy Density
- 320 Wh/kg
- Nominal Voltage
- 3.7 V
Cylindrical Series
AB-21700 Semi Solid Cylindrical Cell
- Energy Density
- 300 Wh/kg
- Nominal Voltage
- 3.7 V